

A Complete Guide To Substack Notes Analytics
Where to find it and what info are available


Everyone knows that Notes are great for introducing ourselves and our Substack to potential new readers. The potential for reach (how many users are reading it) and growth are huge, at least judging from some testimony I’ve heard from some Substackers.
But if we want to be honest, having our Notes go viral is harder than it sounds. Most days we feel as if no one is listening. And the lack of analytics (information about what’s going on with our Notes) felt as if we were blind.
Well, finally those dark days are over, Notes Analytics is here! Thank you Substack!
Now let’s deep dive into it, and see what we have.
Mobile Only - for now
First of all, you can only see the Notes Analytics from the Substack App, at least for now. I have not seen it implemented yet on the website version. I imagine (I hope) Substack will also add it soon.
Where Can I Find It?
From the Mobile App, tap on your Profile Picture and tap on ‘View Profile’.
This will show you your Profile Page.
Under the Activity tab, find your Notes, and tap on it to show the Notes Page.
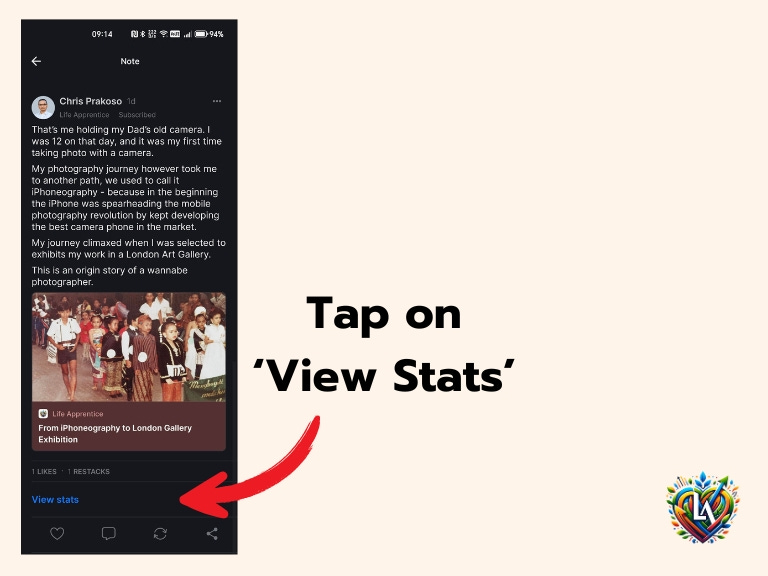
Finally, scroll down until you see a section that says ‘View Stats’ - tap on this to reveal your Notes Analytics.
If you’ve been struggling to create the infamous Substack Wordmark (the banner at the top of this page), I wrote a step-by-step guide to do it.


Notes Analytics Breakdown
Here is the breakdown of what you can observe in this Notes Analytics.
Impressions
Impressions are the total number of times your Note was displayed on screen for any user. The count is unique per user, so if one user saw your Note 3 times, it only counts as 1.

The diagram shows the number of Impressions over time. If you hold your finger over it and swipe horizontally (left to right) you can see a specific number on a particular point in time (date and time).
The diagram also shows 2 graphs, one is the statistics for this particular post - the blue-coloured graph, and the statistics of your Average Impressions - the grey-coloured graph.
Average Impressions is the number of impressions that ALL your Notes have on average at a particular point in time.
What good does this average stats for? It shows how well (or worst) this particular note compared to all your notes.
For example, in mine above, you can see that this note had performed particularly well and above my average.
Surface
Surfaces show the location where the impressions occurred for how many times per user.
Tap on the ‘See All’ button to get the whole list of locations.
If you add up all the numbers, it should be cumulated to the total number of impressions from the previous stats.


My note for example was seen mostly on the main feed page of the user.
Audience
Audience shows you the category of users who had seen your note.
There are 3 categories:
Unconnected: Practically strangers.
Followers: Users who follow you.
Subscribers: Users who subscribe to your publication.

Interactions
Interactions are what actions - Like, Restack, Share - the note had received.
So far I have observed the following interactions in the list:
Like
Restack
Share
Link Clicked
Profile Visit
Please let me know if you see anything else, and I will add it to the list.

I am very happy that Substack added these analytics to Notes. Now I can at least observe what happened to my notes and make an analytical decision about what to do in the future.

👋🏾Hi, I’m Chris, I share thought-provoking insights on personal development, healthy living, travel tales, parenting, life lessons and technology trends, as well as life lessons learned like this one you are reading. Please consider subscribing if this resonates with you.
My favorite statistic to look at is ‘Profile Visit’. I feel pretty good about the quality of my note if it compelled someone to stop and check out who I am.
thank you, Chris. I've been looking at the stats, but this provides a very in depth explanation and I appreciate it 🙏